As Q4 2025 unfolds, cryptocurrency markets display compelling technical and fundamental indicators suggesting potential continuation of the current bull market through year-end. Comprehensive analysis of on-chain metrics, institutional flow patterns, and technical chart formations provides investors with data-driven insights for navigating the final quarter of what has proven to be an exceptional year for digital asset performance.
Exchange Reserve Depletion Indicates Supply Shock
Bitcoin and major cryptocurrency balances on centralized exchanges have declined to multi-year lows, with Bitcoin exchange reserves dropping to approximately 2.1 million BTC, the lowest level since December 2018. This 340,000 BTC reduction from September 2025 levels indicates strong holder conviction and reduced selling pressure. Historical patterns demonstrate that sustained exchange outflows precede significant price appreciation, as decreased supply availability amplifies demand impact on market prices. Ethereum exchange balances similarly fell to 11.8 million ETH, representing a 15% quarterly decline.
Institutional Accumulation Patterns Accelerate
On-chain data reveals that addresses holding between 100-10,000 BTC (typically institutional entities) accumulated approximately 185,000 additional Bitcoin during October, the strongest monthly accumulation since March 2024. This cohort now controls 42% of circulating Bitcoin supply. Simultaneously, corporate treasury additions continue with publicly-traded companies including Strategy (formerly MicroStrategy), Marathon Digital, and Tesla maintaining accumulation strategies. The aggregate institutional allocation represents validation of Bitcoin's macro investment thesis and long-term value proposition.
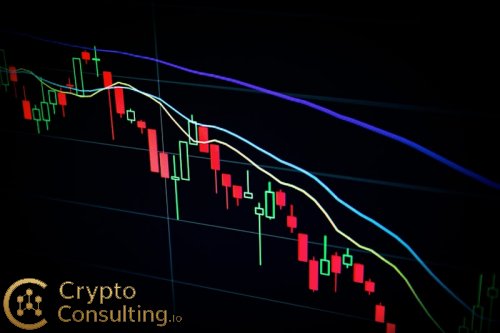
Technical Chart Analysis and Key Levels
Bitcoin's price structure exhibits classic bullish continuation patterns across multiple timeframes. The weekly chart shows a sustainable uptrend with higher lows and higher highs, while the daily 50-day moving average ($61,200) provides strong support. Key resistance levels at $70,000 and $73,500 represent the final barriers before price discovery into new all-time high territory. The Relative Strength Index (RSI) maintains healthy readings between 55-65, avoiding overbought extremes that typically precede sharp corrections. Volume profile analysis indicates strong buyer support zones between $58,000-$62,000.
Macroeconomic Tailwinds and Risk Factors
Several macroeconomic factors support continued cryptocurrency appreciation, including Federal Reserve interest rate stabilization, weakening dollar index (DXY), and institutional acceptance as evidenced by sustained ETF inflows. However, investors should monitor potential headwinds including: traditional market volatility spillover effects, regulatory policy changes following U.S. election cycles, and typical Q1 seasonal weakness patterns. Risk management strategies should incorporate these variables while capitalizing on favorable Q4 seasonal trends that historically deliver strong performance.